Posts tagged diatom

High Impact Science in Antarctica

The Mertz Glacier as seen in 2007, extending 75 km out into the Southern Ocean

Antarctica was in the news this weekend when a 97 kilometer long iceberg the size of Luxembourg collided with the floating Mertz Glacier, breaking the famous glacier off at the base and generating a 2500 sq. kilometer iceberg. Each of these behemoths weigh several hundred billion tons, so the impact must have been quite a crunch!
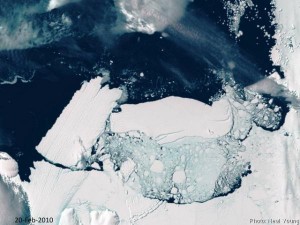
Iceberg B9B collides with Mertz Glacier Tongue

At right is an image taken February 20th, several days after the impact: the broken Mertz Glacier Tongue is on the left side of the photo, and the colliding B9B iceberg is near the center-right. The Mertz Glacier, which was sheared off at the base, was a significant barrier to westward drifting sea ice. The Mertz Glacier is on the George V coast of East Antarctica, a region is famous for its high-velocity katabatic winds: sustained wind velocities at nearby Dumont D’Urville have reached 199 m.p.h! These winds blow the pack ice out to sea, and because of the blocking geometry of the Mertz Glacier, this area generally remains ice-free all winter.
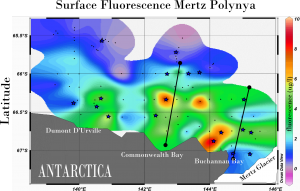
Fluorescence map of the Mertz Polynya in December 2007 (mertz Glacier is in lower right). Surface blooms are in red, and marine metagenomic samples were taken in areas marked with a star.

In the Austral summer of 2007, scientists from the J. Craig Venter Institute visited this ice-free area, or polynya, as part of the International Polar Year’s Census of Antarctic Marine Life (CAML). Because sunlight can freely penetrate the water column, polynyas are areas of enhanced productivity. Diatoms and other phytoplankton form massive springtime blooms, supporting whales, penguins, and much of the Antarctic food chain. Above is a fluorescence ‘bloom map’ of the Mertz Polynya, just west of the Mertz Glacier. Our expedition on board the Aurora Australis attempted to capture a biological snapshot of the entire region, and Jeff Hoffman and I were able to collect samples ranging from thick blooms of Phaeocystis antarctica to oligotrophic cold-water upwellings at the base of the Mertz Glacier.
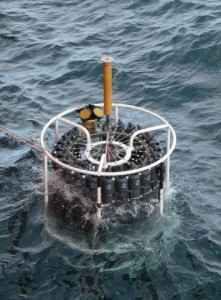
CTD Rosette being deployed at the base of the Mertz Glacier to collect a sample from 1320m deep

CTD Rosette being deployed at the base of the Mertz Glacier to collect a sample from 1320m in depth

The region around the Mertz Glacier is equally famous as one of three regions where Antarctic Bottom Water is formed (the other two are the Ross and Weddell Seas). Bottom water is created where saline water is extruded from newly formed sea ice. This cold dense water sinks from the surface and becomes distributed into all of the world’s major ocean basins. Because the sea-ice in a polynya is continuously formed and blown out to sea, there is near continual production of brine and bottom water. While in the Mertz Ploynya, Jeff and I used the ships 24-bottle CTD rosette to sample some of this bottom water, and one of the samples came from Buchanan Bay, right next to the area where the glacier split. This sample came from a depth of 1320m, and may yield insight into bacterial activities at the base of the water column. Additional deep water samples were taken in the Adelie Depression , the Mertz Bank, and the Mertz Depression, and one sample came from a depth of 3,690 m in the Southern Ocean.

Almost half of the water samples we collected have been sequenced using 454 sequencing technology and are in the process of annotation. This biological data will form an important baseline as this region undergoes rapid change: loss of the protective geometry of the Mertz Glacier will likely cause changes in the formation of the Mertz Polynya, influencing both the biology of the annual spring bloom and the dynamics of bottom water formation. Stay tuned for more updates on this exciting event and on the microbiology of the region.
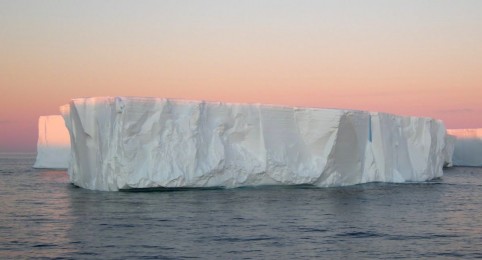
Tafelbergs floating in the morning light, Mertz Polynya, December 2007

Station IV: The Ice Edge

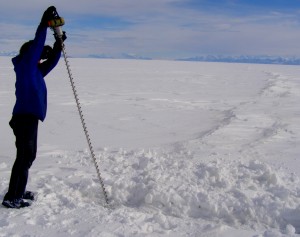
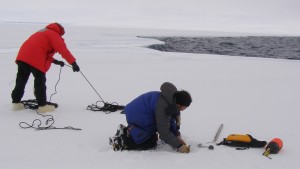
Brian sets up an ice anchor while Jeff Hoffman flakes out a belay rope.  The ice edge is in the background.

Brian sets up an ice anchor while Jeff Hoffman flakes out a belay rope. Jeff and I belayed Brian to the ice edge, where he tested the ice stability.

Our last station in our Ross Sea transect was out at the ice edge, about two miles north of our previous station, Station III. We were interested to see how plankton in the open polynya were different from the phytoplankton we isolated from areas locked in sea-ice. Polynyas are ice-free areas of open ocean and are highly productive, and the photosynthetic activity of diatoms and other phytoplankton of the polar regions are thought to be important components of the global carbon cycle.

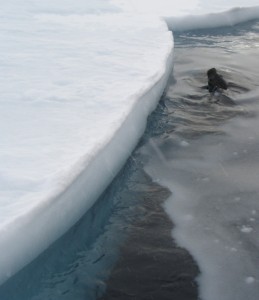
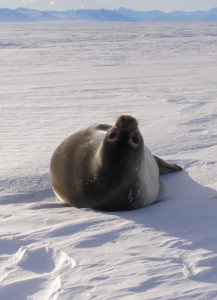
the sea-ice thickness where we were working. A weddell seal kep an eye on us while we worked.

The bottom of the sea ice can be seen in this picture. A nearby Weddell Seal watched us.

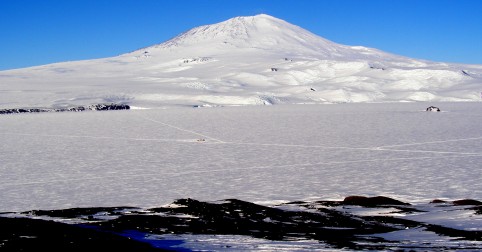
We left our heavy vehicles at Station III and took lighter snowmobiles out towards the open water. The Ross Sea polynya is one of the largest polynyas in Antarctica, and the sight of open water after weeks in Antarctica’s frozen environment was totally thrilling. Distant pack ice dampened the incoming Southern Ocean swell, so there weren’t large waves breaking over the ice, and in the distance we could see icebergs floating on the horizon. Near the waters edge, we stopped the snowmobiles short and set up a belay station. Using ropes, we belayed Brian out to the edge of the ice, where he drilled to test the thickness of the ice. The thickness was just over two meter, and if you peered over the edge, you could just make out the underside of the sea ice. We unpacked our sample gear and Jeff and I started to set up a filtration station.

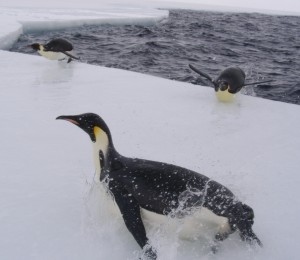
Emperor penguins pop over the ice edge and toboggan towards us

Emperor penguins pop over the ice edge and toboggan wildly across the slick ice

As we were connecting up our tubing and air compressor, we heard some noise from the ice edge, and suddenly dozens of emperor penguins began boiling up out of the water and landing directly onto the ice. They landed with big plops on their bellies, and quickly tobogganed away from the ice edge, splashing through the slush and creating a total rucus. It is doubtful an approaching penguin can see the top side of the ice - they pop onto the ice blind, so standing near the ice edge carried the non-negligible risk of getting knocked over by a 70 pound flying penguin!

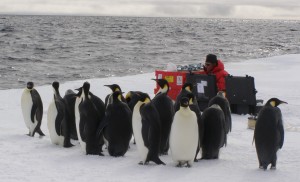
Emperors gather as we set up our filter station

Emperors gather as we set up our filter station

We set up our plankton filtration station, and as we worked our audience of flightless birds grew. Emperor penguins are extremely curious animals, and they fearlessly let us know that we were in their domain. At times they would waddle around our filters and pumps, silently looking over our set-up and seemingly unperturbed by our noisy gasoline-powered air compressor.

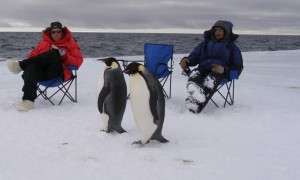
Beach chair moment: Jeff and Brian wait for our filters while penguins walk about and survey our work

Beach chair moment: Jeff and Brian wait for our filters while penguins waddle and survey our work

Other times they would just stand around and preen, and they were an endless source of amusement. Just as at the previous stations, we collected three separate samples of plankton. One sample is for DNA shotgun sequencing, which we will use to identify the total complement of genes present in the seawater: this can almost be thought of as the genomic potential of the system. Our second sample is mRNA, which is a the total transcriptome of the plankton: this will tell us what genes are actively being used at the time we collected the sample. We are also taking a third sample for analysis of the proteome, or the protein products of the genome.

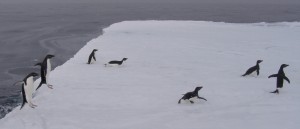
Adelie penguins jump onto ice edge and join in the science

Adelie penguins pop onto the ice and join the science

It takes us about seven hours to filter sufficient volumes of water and harvest enough plankton for these analysis, so in the meantime we sat out on beach chairs, kept an eye to make sure our hoses and pumps didn’t freeze, and watched the penguin parade. Partway through the day a large group of Adelie penguins swam over and joined the scene. Adelie penguins are significantly smaller than Emperor penguins, so when they emerge from the water, they have so much momentum they literally shoot into the air, landing on their feet before tobogganing to safety.

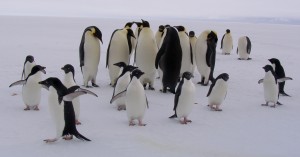
Eventually it became a penguin party

An Adelie (foreground) and Emperor penguin social

The afternoon eventually devolved into a multi-species penguin party, with the birds occasionally waddling over to our filtration racks to see what the red-jacketed aliens were doing, and otherwise just hanging out together, Adelies and Emperors. We were surprised to see this casual behavior, and there was rarely any hostility between the two species of penguins - though I think I saw an Emperor swat an Adelie out of the way once.

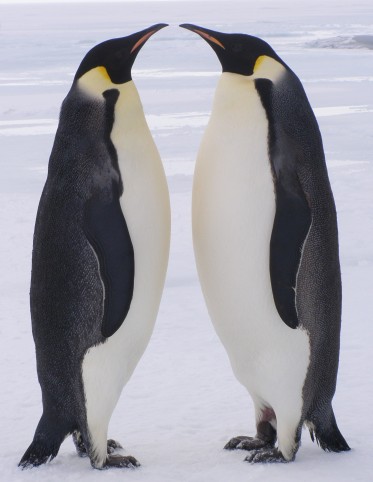
Pair of courting emperor penguins

Pair of courting emperor penguins

Perhaps I’m going a bit overboard with the penguins, but it was truly amazing to watch them while we went about our work, and they generated endless photogenic moments. Many of the emperor pairs were courting: the male stand directly in front of a female, head down, and then slowly raise his head while issuing his song. The female would follow the motion, until they both held heads in the air, and they would hold that posture, ostensibly sizing each other up for potential worthiness as a mate.

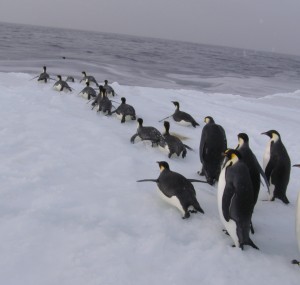
While we were packing our gear the emperor penguins sensed the show was ove,r and they queued up to return to the sea.

While we were packing our gear the emperor penguins sensed the show was over and they queued up to return to the sea.

Towards evening we finished the last of our sampling, and as we began to unhook the filtration lines and hoses, the Emperor penguins sensed the show was over, and began to queue up on the ice. After they were all in an orderly line, they tobogganed back off into the ocean, leaving us to pack up our gear and take our samples back to our mobile research sled. We now had four stations in a transect, starting at land’s edge and traversing out across the frozen Ross Sea to the open water at the Ross Sea Polynya. We were all tired from the effort, and looking forward to some fresh food and heated rooms back in McMurdo Station.

Station II, Inaccessible Island

Our vehicles at Station I (near the center of the photograph)

Our camp at Station I (near the center of the sea ice field)

The second storm of our trip hit us while we were packing up Station I for a return to McMurdo. The winds began gusting over 50 miles per hour, and the visibility dropped to near zero. We had already packed up camp, but the orders came in over the radio that Condition 1 had been imposed on the sea ice route, and we were stuck there until conditions improved. Three of us slept on the floor of the research sled while Mak and I slept in the back of the Pisten Bully. The wind shook and buffeted the vehicle all night, and at times the Pisten Bully made this vibrating sound like we were just about to take off.

Testing ice thickness at a buried sea-ice crack

Matt drills to test the ice thickness across a crack

But by 6 PM the following day, the visibility had improved enough for us to follow the flags along the sea-ice highway and return to McMurdo. In town we picked up another crewmember: Matt Smith, the sea-ice specialist for the US Antarctic Program in McMurdo. We then drove back out to our camp at Station I and spent several hours digging our vehicles out of the snowdrifts. By noon the following day everything was ready again for redeployment, and we set out across the ice for our next station, on the north side of Inaccessible Island.

Weddell seals lounging on the ice are a warning sign for potential cracks

Weddell seals on the ice are a good indicator for nearby ice cracks

The fresh snow had buried many of the obvious ice cracks and features, so Matt and I went ahead on snowmobiles to scout the route while Jeff Hoffman and Mak Saito followed with the sleds. Cracks like the ridgeline in the above photo were relatively easy to spot, and we drilled them to make sure they were a meter thick, which is more than enough to support the weight of our vehicles. Other cracks though were less apparent, but many times those cracks were given away by the presence of seals loafing on the ice - the pup in this picture barely even moved as we rumbled by, and we saw his breathing hole in a hidden crack just a few feet away. We gave that area wide berth. After a few hours of crack testing and route finding, we made it out into McMurdo Sound proper and to our next station.

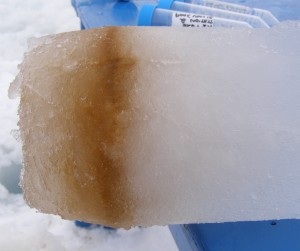
An ice core showing the diatoms growing on the bottom of the sea ice

An ice core showing the diatoms growing on the bottom of the sea ice

The next morning we fired up our generator and drills. I used the Kovacs core sampler to create a large enough hole so that Jeff and I could get our sampling gear down below the ice. We have been wrapping all of our sample tubing in black insulation, as the seawater will rapidly freeze on contact with icy air. This is espeically true in Antarctica, where the wind seems to blow nearly continuously, freezing engines, air hoses, compressors, you name it! I also drilled a number of ice cores so we could obtain some genetic material from the organisms living on the bottom of the ice. Drilling those cores takes a few hours- while I was doing that Jeff Hoffman worked the stainless steel Jeff Hoffman high biomass filterfilter sets and the viral concentrator. In the picture on the left you can see one of the filters for the larger phytoplankton. That particular filter captures anything in the water which is between 3 and 200 microns, which is the size of most of the diatoms and other large phytoplankton. If you have a sharp eye, or a good computer monitor, you can see a slight discoloration of the filter as compared to the edge - that discoloration is from planktonic cells which have become trapped on the filter. To obtain that amount of cells, we had to filter over 400 liters of seawater, and even then, it almost seems less that the amount that was in the ice core. This is possibly due to seasonality in the sea-ice cycle: it is still late spring here, and as summer progresses and the sea ice starts to melt, the diatoms trapped in the sea ice will be released into the water, becoming the seeds for the annual summer phytoplankton bloom in the Ross Sea. Jeff Hoffman and Andy Allen brought back samples last year from the late summer, so between the spring and summer samples we should be able to develop a wider genomic understanding of polar marine phytoplankton.

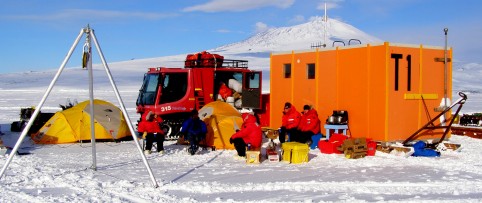
Sea-ice camp at Station II. We used the sled and the vehicles as wind barriers     Taking a break and having some hot beverages at our sea-ice camp at Station II.   We used the sled and the vehicles as a windbreak in case the weather changed.

Enjoying some hot beverages out of the wind at Station II ice camp

Sampling Blooms in Cabo Corrientes

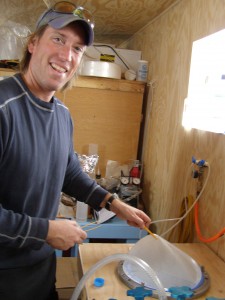
Just south of Puerto Vallarta is Cabo Corrientes, and our satellite data indicate a large bloom extending 25 miles off the coast. As we enter the bloom the water turns an intense green, and there are numerous fish feeding in the area. Sampling conditions are ideal: bright sunshine, light winds, moderate swell. We deploy a large plankton net which rapidly fills with algae and zooplankton. Karen McNish looks at the larger diatoms and zooplankton under the scope while the rest of the crew prepares our instrumentation for deployment.

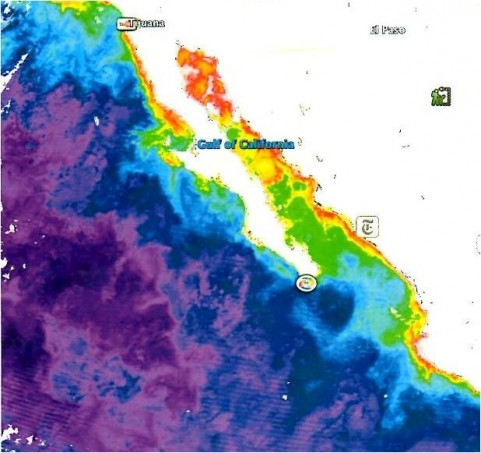
Satellite image of phytoplankton blooms along the Mexican coastline, March 2009.  The Ilsa Cedros bloom is halfway down the Baja peninsula on the west side, the Cabo Corrientes bloom is the red area in the lower right corner of the image.

Satellite image of phytoplankton blooms along the Mexican coastline, March 2009. The Ilsa Cedros bloom is halfway down the Baja peninsula on the west side, the Cabo Corrientes bloom is the red area in the lower right corner of the image.

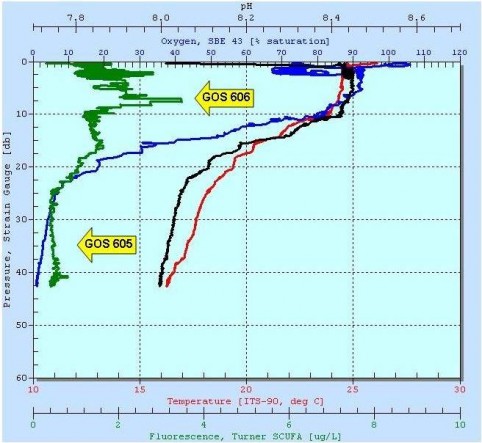
The CTD profile of the water column at Cabo Corrientes showing a surface phytoplankton bloom.

The CTD profile of the water column at Cabo Corrientes showing a surface phytoplankton bloom.

From the aft cockpit we deploy a CTD equipped with a sampling hose. A standard CTD measures conductivity, temperature and depth: our unit also contained a pH probe and a fluorometer for measuring chlorophyll concentration. As we lower the CTD through the water column, we generate a profile of the ocean at Cabo Corrientes down to 40 meters in depth. At left you can see the CTD plot: depth is plotted on the y-axis as a change in pressure, and pH (black) and temperature (red) are plotted on the top two x-axes, with oxygen (blue) and fluorescence (green) plotted on the bottom two x-axes. In this case, the peak fluorescence (green trace) is at 8 meters in depth, and after that, the concentration of oxygen (blue trace) falls from 90% saturated to 5% saturated. The peak fluorescence indicates the location of the chlorophyll max (or Chlmax), where most of the photosynthetic plankton are located, and the oxygen minimum (or O2 min) indicates an area of intense respiration immediately under the Chlmax. Both of these areas contain a wealth of undescribed microorganisms, and understanding the relationship between photosynthesis and respiration in the ocean is one of the keys to understanding the global carbon cycle. We took samples at 8 meters and at 35 meters before continuing our southward trip.